Variance for data with multiple-observation values
Date: 2015-10-07; view: 487.
Mode for data with multiple-observation values
As we already know, the mode is the most frequently occurring value. A similar concept can be used when the data are available in multiple-observation form.
Example:
The following data were collected on the number of blood tests a hospital conducted for a random sample of 50 days. Find the mode.
| Number of tests per day | Frequency (days) |
Solution:
Since 29 days were given on 18 days (the number of tests that occurs most often), the mode is 29.
Suppose that a data set contains values  occurring with frequencies,
  respectively.
1. For a population of  observations, so that

The variance is

The standard deviation is  .
.
2. For a sample of  observations, so that

The variance is

The standard deviation is  .
.
The arithmetic is most conveniently set out in tabular form.
Example:
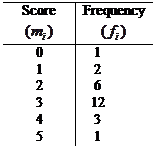
The score for the sample of 25 students on a 5-point quiz are shown below.
Find a sample variance and standard deviation.

Solution:
Remark: The denominator in the formula  is obtained by summing the frequencies
  . It is not number of classes.
To calculate variance we need three columns to display the computation of the quantities  a column for the
  a column for the
  and a column for the
  . We also need a column for
  and a final column for the products
  . (Table 1.5)
The necessary computations for finding  are shown below.
Table 1.5
Score

| Frequency

| 
| 
| 
|
| 0-2.7=-2.7 1-2.7=-1.7 2-2.7=-0.7 3-2.7=0.3 4-2.7=1.3 5-2.7=2.3 | 7.29 2.89 0.49 0.09 1.69 5.29 | 0· 7.29=0 1· 2.89=2.89 2· 0.49=0.98 3· 0.09=0.27 4· 1.69=6.76 5· 5.29=26.45 | ||

| 
|
Thus we have 
 .
.
Example:
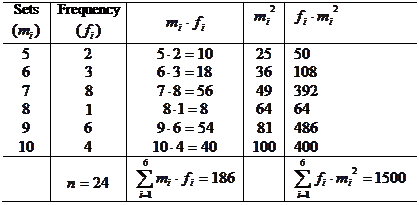
The number of television sets sold per month over a two year period is reported below. Find the variance and standard deviation for the data.
Number of sets
sold 
| Frequency (month)

|
Solution:
Let us apply  .
.
Make a table as shown below


To find standard deviation we take the square root of variance
 .
.
| <== previous lecture | | | next lecture ==> |
| Median for data with multiple-observation values | | | Exercises |