Exercises
Date: 2015-10-07; view: 643.
1. In survey of 20 patients who smoked, the following data were obtained. Each value represents the number of cigarettes the patient smoked per day. Construct a frequency distribution, using six classes.
10 8 6 14 22 13 17 19 11
9 18 14 13 12 15 15 5 11
16 11
Draw frequency, relative frequency and cumulative relative frequency histograms.
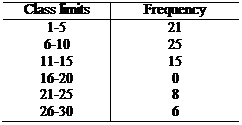
2. For 75 employees of a large department store, the following distribution for years of service was obtained. Construct histograms for frequency, relative frequency, and cumulative relative frequency.

3. In a study of 32 student grade point averages (GPA), the following data were obtained.
3.2 2.0 3.3 2.7 2.1 3.9 1.1 3.5 1.9
1.7 0.8 2.6 0.6 4.0 3.5 2.3 1.6 2.8
2.6 1.6 1.6 2.4 2.6 2.3 3.8 2.1 2.9
3.0 1.7 4.0 1.2 3.1
Construct histograms for frequency, relative frequency and cumulative relative frequency.
4. To determine their lifetimes, 80 randomly selected batteries were tested. The following frequency distribution was obtained. The data values are in hours given in table 1.11
Construct histograms for frequency, relative frequency and cumulative relative frequency.
Table 1.11

| <== previous lecture | | | next lecture ==> |
| Frequency distribution. Grouped data and histograms | | | Mean for grouped data |