The mean
Date: 2015-10-07; view: 533.
Introduction
Organization and description of data
Chapter 1
Statistics is a group of methods that are used to collect, analyse, present, interpret data and make decisions.
Statistics is sometimes divided into two main areas:
1. Descriptive statistics
2. Inferential statistics.
Descriptive statistics consists of the collection, organization, summation, and presentation of data.
A population is a complete set of units (usually people, objects, events) that we are interested in studying.
A subset of the population selected for study is called a sample.
Inferential statistics is an estimate or prediction about a population based on information contained in a sample.
The mean for ungrouped data, also known as the arithmetic average, is found by adding the values of the data and dividing by the total number of values. Thus,
Mean for population data: 
Mean for sample data: 
where  is the population size,
  is sample size,
  (Greek letter mu) is the population mean, and
  (read as “
  -bar ”) is the sample mean.
Example:
Calculate the mean of the following six sample observations:
5, 2, 6, 8, 7, 8
Solution:
Using the definition of sample mean, we find
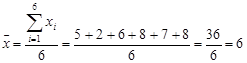 .
.
Thus, the mean of this sample is 6.
Example:
The salaries of all 7 employees of a small company are:
$ 320, 410, 310, 480, 530, 370, 240
Find the mean salary.
Solution:
Since the given data set includes all 7 employees of the company, it represents the population. Hence,  . The population mean is
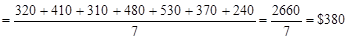 .
.
Thus, the mean salary of the employees of this company is $380.
| <== previous lecture | | | next lecture ==> |
| Selecting an overall positioning strategy | | | The median |