Variance and standard deviation for grouped data
Date: 2015-10-07; view: 751.
Answers
1.12.8;12.57; 14; 2. 27.20; 26.7; 25; 3. 74.40; 74.67; 80; 4. 23.72; 23.417; 23; 5. 33.8; 31.5; modal class =27-33.
Suppose that we have data grouped into K classes, with frequencies
 . If the midpoints of these classes are
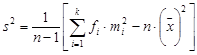
  , the mean and variance of the grouped data are estimated by using following formulas
1. For a population of  observations, so that

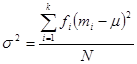
The variance is
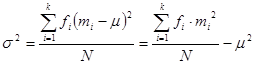
The standard deviation is  .
.
2. For a sample of  observations, so that
The variance is
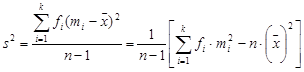
The standard deviation is  .
.
Example:
The following table gives the distribution of the number of days for which all 40 employees of a company were absent during the last year
| Number of days absent | Number of employees |
| 0-2 3-5 6-8 9-11 12-14 |
Calculate the variance and standard deviation.
Solution:
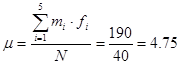
Let us apply
First we need to find  and
and 
Class

| Number of days absent | Number of employees 
| Class mark

| 
|
| 0-2 3-5 6-8 9-11 12-14 | ||||

|
Now we need to find 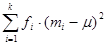 .
.
In order to find products  we must first find the square quantities
  . We need three columns to display the computation of the quantities
  a column for , a column for
  , and a column for the . We also need a column for
  and a final column for the products
  . The necessary computations are shown below in the table 1.13.
Table 1.13.
| Class
| Class mark

|
| 
| 
| 
|
| 1-4.75=-3.75 4-4.75=-0.75 7-4.75=2.25 10-4.75=5.25 13-4.75=8.25 | 14.06 0.56 5.06 27.56 68.06 | 182.81 7.88 30.38 110.25 204.19 | |||
| 535.51 |
In the end,
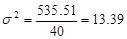 and
and 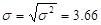
Example:
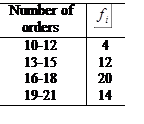 The following table gives the frequency distribution of the number of orders received each day during the past 50 days at the office of a mail-order company. Calculate the variance and standard deviation.
Solution:
Because the data includes only 50 days,
it represents a sample. Hence, we will use sample formulas to calculate the variance and standard deviation.
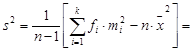
Let us apply
All the information required for the calculation of the variance and standard deviation appears in the following table
| Number of orders |
|
| 
| 
| 
|
| 10-12 13-15 16-18 19-21 | |||||
| N=50 |

By substituting the values in the formula for the sample variance, we obtain
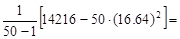

Hence, the standard deviation is 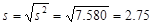 .
.
Thus, the standard deviation of the number of orders received at office of this mail-order company during the past 50 days is 2.75.
| <== previous lecture | | | next lecture ==> |
| Exercises | | | Interquartile range for grouped data |