Explaining numbers, charts, pie charts, graphs, tables. - Some useful phrases.
Date: 2015-10-07; view: 532.

Here are some other ways to describe an increase:
| a dramatic increase a sharp rise a small increase | to rise steadily I expect there to be ... I predict there`ll be ... |
| I believe there`ll be a dramatic rise in private car owners ... |

Some more ways to describe a decrease:
a dramatic decrease
a sharp / slight / steady fall
to fall sharply/gradually
to go down significantly
To describe a decrease, you can also say:
There was a drop in sales or sales dropped.

Here are some ways of describing something which stays the same:
The number has reached a plateau.
The number has levelled out.
Staff numbers have stabilized.
... sales stayed more or less the same.

| Sales of Brighter Smile toothpaste peaked in Mayof last year. However, Shine Hair shampoo is not doing so well. It entered a trough in October last year. Sales are still below expectations. |
Peakedis used here to describe the highest point in the number of sales. Here are some other some examples:
Sales peaked. // Sales reached a high point (at ...) ... .
And some ways to describe low points in a graph:
Sales reached a trough. // Sales reached a low point (at ...) ... .


Transport in Shanghai
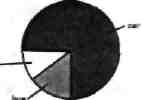
| The point is illustrated in this pie chart. In Shanghai, 75 per cent of people still use a car to get around; only 20 per cent use the bus and a much smaller 5 per cent use taxis. So, the most popular form of public transport is still the car. |
Sections of a pie chart can be described as percentages or fractions. For example:
25 per cent of people ... // A quarter of the people ... // ... the most popular form of public transport is still the car.
These expressions compare and contrast information in a pie chart or other visual aid. Some other expressions include:
The most popular/the best selling/the fastest selling ...
The third most popular/the second biggest/the fourth largest ...
The least commonly used/the least popular ...


When describing a flow chart the order of the stages is important. Here is the language needed:
First ... / The first stage is ...
Then ... / Next ... / After that, ...
Finally, ... / Lastly, ...

| Cheetah | 1.2L | 1.4L | 1.6L | 2.0L |
| Audio-system | + | + | ||
| Sunroof | + | + | + | |
| Security system | + | |||
| Satellite navigation system | + |
The table above shows the extra features that come with the new Cheetah sports car. The models are listed here in the top rowand the extras are listed on the left. As you can see, our up-to-date security system does not come with the Cheetah 1.4L but it does come with the Cheetah 1.6L. Also, we have not included the security system as an extra feature for the Cheetah 2.0L because we are offering the satellite navigation system in its place. According to our market research, these features should give us a good position in the market place.
| <== previous lecture | | | next lecture ==> |
| If you are short of time. | | | Step 4: Create and use effective visuals |