Exercises
Date: 2015-10-07; view: 693.
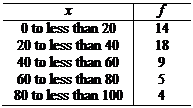 1. For 50 airplanes that arrived late at an airport during a week, the time by which they were late was observed. In the following table, x denotes the time (in minutes) by which an airplane was late and f denotes the number of airplanes.
a) Find the mean
b) Find the median
c) Find the mode
d) Find the variance and standard deviation
e) Find the interquartile range.
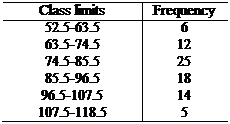
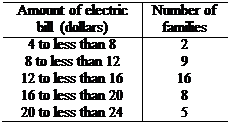 2. The following table gives information on the amount (in dollars) of the electric bills for a sample of 40 families.
a) Estimate the sample mean
b) Estimate the median
c) Estimate the mode
d) Estimate the variance and standard deviation.
e) Estimate the intequartile range.
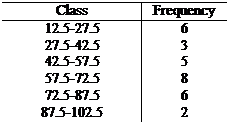
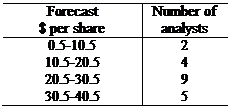 3. A population of all twenty financial analysts was asked to provide forecasts of earnings per share of a corporation for next year.
The results are summarized in the table.
a) Find the relative frequencies.
b Find the cumulative frequencies.
c Find the cumulative relative frequencies.
d) Estimate the population mean.
e) Estimate the population variance.
f) Estimate the population standard deviation.
g) Estimate the population mode.
h) Estimate the population median.
i) Estimate the intequartile range.
j) Which class is modal class?
4. A sample was taken of flights arriving at a major airport to study the problem of air traffic delays. The table shows numbers of minutes late for a sample of 100 flights.
| Minutes late | 0-10 | 10-20 | 20-30 | 30-40 | 40-50 | 50-60 |
| Number of flights |
a) Draw the histogram
b) Find the sample relative frequencies
c) Find and interpret the sample cumulative relative frequencies
d) Estimate the sample mean number of minutes
e) Estimate the sample variance and standard deviation
f) Estimate the sample median number of minutes late
g) Estimate the intequartile range
h) Which is the modal class for this sample?
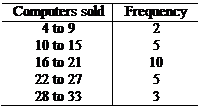 5. The following table gives the frequency distribution of the number of computers sold during the past 25 weeks at a computer store.
Calculate the mean, variance, and standard deviation.
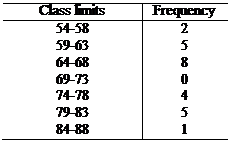
 6. Eighty randomly selected light bulbs were tested to determine their lifetimes (in hours). The following frequency distribution was obtained
Find the variance and standard deviation.
 7. The following data represent the scores (in words per minute) of 25 typists on a speed test.
Find the variance and standard deviation.
8. For a sample of fifty new full-size cars, fuel consumption figures were obtained and summarized in the accompanying table
| Fuel consumption | 14-16 | 16-18 | 18-20 | 20-22 | 22-24 |
| Number of cars |
a) Draw the histogram.
b) Find the sample relative frequencies.
c) Find and interpret the sample cumulative relative frequencies
d) Estimate the sample mean fuel consumption.
e) Estimate the sample standard deviation of fuel consumption.
f) Estimate the sample median fuel consumption.
g) Estimate the sample intequartile range.
h) Which is the modal class for this sample?
9. The fuel capacity in gallons of 30 randomly selected cars is shown below.
Find
a) Mean
b) Median
c) Modal class
d) Variance
e) Standard deviation
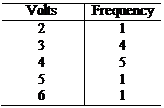 10. Twelve batteries were tested after being used for one hour. The output (in volts) is shown below.
Find each of the following
a) Mean
b) Median
c) Mode
d) Range
e)Variance
f) Standard deviation.
11. For a sample of twenty-five students from a large class, the accompanying table shows the amount of time students spent studying for a test
| Study time (hours) | 0-2 | 2-4 | 4-6 | 6-8 | 8-10 |
| Number of students |
a) Draw the histogram.
b) Find and interpret the cumulative relative frequencies.
c) Estimate the sample mean study time.
d) Estimate the sample median.
e) Find the modal class.
f) Estimate the sample variance.
g) Estimate the sample standard deviation study time.
h) Estimate the sample intequartile range.
| <== previous lecture | | | next lecture ==> |
| Interquartile range for grouped data | | | Звернення Президента України Ющенка В. А. до українського народу на Майдані Незалежності 23 січня 2005 р. |